Plant Hexcellence™ – Plant
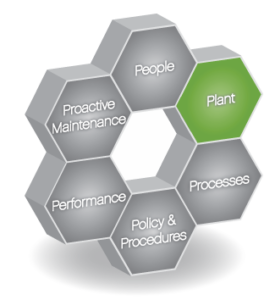 In the previous article describing the Plant Hexcellence™ model, we started with people and just as we said that all change starts with the people, the purpose of that change revolves around the plant or assets themselves. Inherent with having a manufacturing company has a manufacturing site and equipment to create the widget or product you are selling. Without the plant, there is no need for the people or any change.
The Plant Cell encompasses more than just physical assets–it also includes the methods, risk evaluation and mitigation strategies you’ll employ to keep your plant performing optimally.
This cell of the model will focus on your organization being able to answer:
- What to maintain?
- Why maintain?
- How to maintain?
- When to maintain?
- Who to maintain?
- Where to document maintenance and action?
- What are the costs involved?
- What are the consequences of non-performance of maintenance?
EAM / CMMS / AMS
Enterprise Asset Management / Computerized Maintenance Management System / Asset Management System
Just as the human body has a backbone, then a manufacturing or heavy asset-based organization needs an EAM/CMMS/AMS. For the purpose of this article, we will use the term CMMS representing all of these types of systems as we are not trying to define the difference of each.
The CMMS creates the structure that you use to attach all information about an asset. It gives the ability to track the life of each asset and all that has happened to it as well as what was done to it. It is impossible to recommend one CMMS system over another. Fit for purpose dictates that each company/organization has different operating context, business drivers, and technical requirements. It also states that culture, process sophistication, technical backbone and budget play a major role in which type is right for the end user.
Risk-based Criticality Analysis and Ranking
The CMMS may provide an organization the backbone, but the heart of reliability and asset management definitely belongs to the Risk-Based Criticality Analysis. A wise man once said, “All assets are created equal, some are just more equal than others.” It’s important to note that just creating or defining criticality is only half the story; you must add the risk factor to give any real definition to the asset management strategy. The criticality method and tool utilizes the business balance method that we have discussed previously:
- Safety,
- Environmental and
- Profitability
If anyone of these three components is out of balance, then the company or organization is at risk of going out of business. Just as all implementation and processes must be fit for purpose, so too are the tools. The criticality and risk evaluation process is a facilitated approach, and no one individual should make all decisions. Even though there are predefined criteria in each of the classifications, tools easily define or alter the definitions to match current / existing definitions being utilized by the company or organization. It is important to note that all definitions should be supported or substantiated within regulatory bodies if applicable.
Safety – Plant Hexcellence uses the definitions within the API standards for safety. Class I through Class IV.
Environmental – uses well-defined descriptions as listed by the OSHA Process Safety Management (PSM) Standards with a range from “no effect, no impact on the environment” to failure would cause “a major discharge or release requiring evacuation of personnel, Extensive cleanup, immediate notifications and off-site impacts.”
Profitability – Profitability is looked at from 3 perspectives. The first is a range of lost revenue as a result of downtime measured in hours of downtime. The second is the cost of repair, which includes the manpower and material to restore the asset/system back to original condition. The 3rd are fines, penalties or loss of the contract as a result of the downtime condition from missing a dead line or having to ship short.
Additionally, Using a weighted logic behind these three components will deliver a raw criticality number, which can be tied to each asset within the CMMS.
The ranking of an asset by risk is created by looking at the criticality of the asset and combining it to two weighted factors; 1. The current probability of failure on each asset or asset type that an organization is experiencing today. It is important to utilize the plant’s actual data as much as possible as what is occurring at that site could be drastically different from what is occurring at other sites or in
- The current probability of failure on each asset or asset type that an organization is experiencing today. It is important to utilize the plant’s actual data as much as possible as what is occurring at that site could be drastically different from what is occurring at other sites or in industry in general.
- The assessed physical condition of the asset. By utilizing this method, it is possible to rank all assets by risk. This risk ranking will be divided into sub groups that will be utilized to determine:
- What is the appropriate mitigation strategy to create the Asset Management program and tasks?
- What specific tasks are necessary to maintain the facility?
- What is the resource requirement, timing and operation context for each task?
- What is the total number of personnel required to execute the tasks to maintain the facility
- What skills are required of the personnel to accomplish the tasks and maintain the facility
- Better daily and weekly planning
- Foundation for the MRO sparing strategy
NOTE: The risk-based criticality has more effect on long-term asset health and management than any other facet.
Once the risk ranking is established, levels or zones can be determined to apply PROPORTIONAL strategy and resources. The different strategies are listed below in order of highest risk to lowest.
Mitigation Strategies
- Reliability Centered Maintenance (RCM) – SAE Compliant RCM methodology to determine all asset functions and partial/complete loss of that function, the consequence of the failure mode and Preventive / Predictive methods required to identify potential failure. This method is traditionally used on a small number of assets or systems. It is usually for very high risk: Safety of Life, Property or Environmental
- Failure Modes Effects Analysis (FMEA) – Much faster than RCM. More readily used and recognized. Used on a large portion of assets in short time. It is the 80% answer to developing the PM program.
- Streamlined RCM – A shorter faster version of RCM. We view this at the same level regarding risk mitigation as FMEA. This version of RCM does not take a zero-based approach with each asset.
- Condition Based Maintenance (CbM) – This is exactly as the name implies. It is executing maintenance based on the asset’s condition versus time-based. There are industry standards usually to support this method. i.e., You do not need to do an RCM/FMEA to know that electrical components and panels should have an Infrared scan annually at a minimum.
- Predictive Maintenance (PdM)
- Preventive Maintenance Inspection
- Maintenance Task Analysis (MTA) – A method of focusing RCM/FMEA principles on the lower / non-critical assets and components with a concentration on known failure modes. Many times it is a modification of existing OEM PM programs but will also be applied to corrective maintenance practices.
Preventive Maintenance Program Optimization
There are a number of methods in industry. This is taking an existing PM program and through a systematic method, reviewing all tasking to ensure that it adds value and is still valid. Two such methods are PMO2000 and Fast Track RCM.
MRO Inventory and Spare Parts
We have a plant, so therefore we must have a warehouse full of spare parts to fix it when it breaks, Correct? That is not correct. All too often in many businesses, the warehouse has very little rhyme or reason as to what parts and in what quantity are in it? Very seldom is there a method to determine: How many parts should there be? When do I reorder? Should we add a part to the warehouse etc.?
By industry data, the carrying cost of an asset sitting on the shelf in the warehouse is an unbelievable 30% of the original value annually. That being said, if an asset was $10.00 at purchase, then the site is paying $3.00 per year to have it on the shelf. That value is a conglomeration of Taxes, Handling fees, energy costs, personnel costs, obsolescence, disposal fees, etc.
You have to ask yourself, why do we even have a warehouse? Is it because we need to parts to fix the plant or is it really because we do not know when the plant or asset is going to fail?
Just as we have discussed above with using risk levels to determine proportional mitigation strategies for maintaining the assets, the same is true for the sparing strategy, which includes a subset of a critical spares strategy.
- Plan for Every Part (PFEP) – Manufacturing Excellence advocates have a plan for every part. This is two-fold:
- 1. A plan for every asset that could fail.
- 2. A plan for every spare part
- Critical Sparing Strategy – As a subset of the MRO spares strategy, there must be a method, criteria or formula to determine what is a critical spare.
- Inventory Accuracy – Best in class organizations, maintain over 98% accuracy.
- Max/ Min Calculations – Formula-based with a subjective factor to determine consistently what is the right number of parts to maintain.
- ABC Methodology – A method of determining fast and slow-moving parts. ABC is defined as 80/15/5% respectively of spares from fast to slow-moving spares
- Cycle count strategy and engagement that is relative to ABC methodology
- FIFO/LIFO – First in- First Out / Last in First our – To prevent using out of code or expired product. To prevent creating obsolescence on the shelf and having to dispose of product which requires repurchase and extensive disposal fees
- Warranties – it is common to see 1 in 20 organizations tracking warranties. The average savings or addition to the bottom line is between 2-3% of the asset inventory value.
- Physical Asset Program – Is a comprehensive strategy looking at short and long-term replacement of major capital assets. The strategy should include a 1,3,5 year budgeting cycle.
- Asset Integrity Management Programs – Integrity refers to the integrity of the system not only from the physical containment (no leaks) but also from the integrity of being able to deliver the medium to all areas without breaks, interruption or delay. As necessary, the program must be compliant with OSHA – Process Safety Management (PSM)
As you can see, there is a lot of specific activities and functions covered in the Plant cell. Often times, there is not enough thought or resources given to this cell, with CMMS implementations, risk-based ranking of assets and parts. It is only when you truly understand what is in your plant and have created the electronic version of your plant, can you start to make the business decisions required to improve your plant performance.
The Plant Hexcellence Model is a proven model that was developed by Scott Kelley at Geometric Reliability but is the model of choice for Eruditio, LLC. If you are interested in the Plant Hexcellence model for your site or organization, please contact [email protected].
Remember, to find success; you must first solve the problem, then achieve the implementation of the solution, and finally sustain winning results.
I’m James Kovacevic
Eruditio, LLC
Where Education Meets Application
Follow @EruditioLLC
References;
- Plant Hexcellence Model
- Free PDF Download on Plant Hexcellence – Plant
- Scott Kelley
- Geometric Reliability
- What a Plant Consists of: A Plant Hexcellence Discussion – Rooted In Reliability
- The Importance of an Asset Management Model – Rooted In Reliability
- The ABC’s of Asset Management – Rooted In Reliability
*This post was originally written by Scott Kelley of Geometric Reliability and modified by James Kovacevic

