Knowing How Equipment Fails Allows Effective Plans to Be Put In Place and Improve Equipment Reliability
Identifying How Equipment Fails

Steve Jurvetson
In the 1960s the failure rate of jet aircraft was high even with the extensive maintenance programs that were put in place to prevent the failures. The programs required overhauls, rebuilds and detailed inspections which required the various components to be disassembled. All of these activities were based on an estimated save life of the equipment.
Under the guidance of the FAA, extensive engineering studies were conducted on all of the aircraft in service to determine the source of failures. United Airlines pioneered and published a report on the failures which turned the industry on its head. The concluded that only 9% of the failures were related to the age of the aircraft. The rest were random in nature or induced by the very maintenance work that was put in place to prevent them.
As a result of these findings, many of the extensive maintenance programs were reduced and the reliability of the aircraft went up!
I remember when I first started in maintenance and was in charge of preparing a maintenance strategy for a new production line. I was under the impression that equipment fails with age and as such built an extremely intense program to stop these failures. The availability of the line was not high and did not improve regardless what we added to the program. I then found the book RCM2 by John Moubrary, which after reading led me down a new path. This new path cause me to scrap almost the entire program I spent a year building. The results? Improved availability and less overtime.
How Equipment Fails
The report from United Airlines highlighted six unique failure patterns of equipment. Understanding these patterns illustrates why the reduction in maintenance could result in improved performance.
- Failure Pattern A is known as the bathtub curve and has a high probability of failure
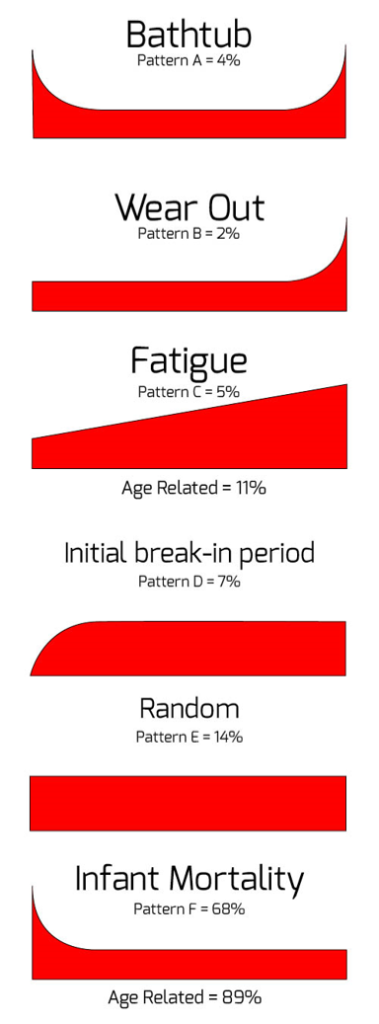
when the equipment is new, followed by a low level of random failures, and followed by a sharp increase in failures at the end of its life. This pattern accounts for approximately 4% of failures.
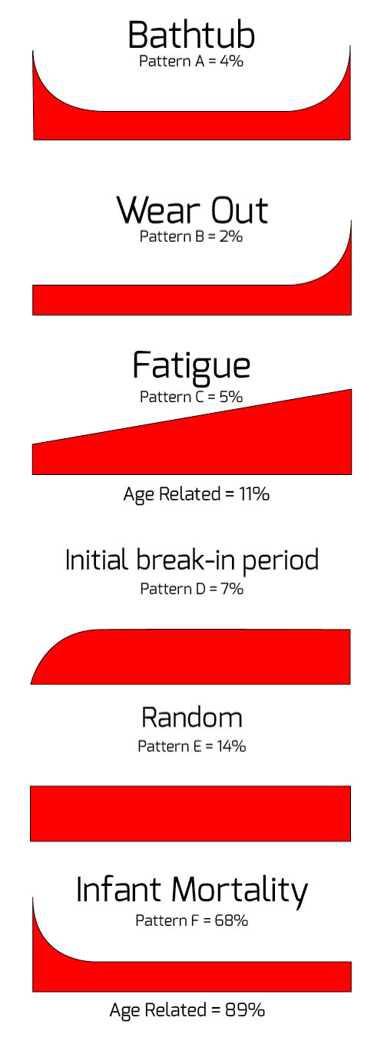
- Failure Pattern B is known as the wear out curve consists of a low level of random
failures, followed by a sharp increase in failures at the end of its life. The pattern accounts for approximately 2% of failures.
- Failure Pattern C is known as the fatigue curve and is characterized by a gradually
increasing level of failures over the course of the equipment’s life. This pattern accounts for approximately 5% of failures.
- Failure Pattern D is known as the initial break in curve and starts off with a very low level of failure followed by a sharp rise to a constant level. This pattern accounts for
approximately 7% of failures
- Failure Pattern E is known as the random pattern and is a consistent level of random failures over the life of the equipment with no pronounced increases or decreased related to the life of the equipment. This pattern accounts for approximately 11% of failures.
- Failure Pattern F is known as the infant mortality curve and shows a high initial failure rate followed by a random level of failures. This pattern accounts for 68% of failures.
What These Pattern Tell Us
When looking at the failure patterns, the first three can be group together as the equipment having a defined life, in which the failure rates increase once the equipment has reached a certain age. This age may be time or usage such as hours, widgets produced etc. The failures are usually related to the wear, erosion or corrosion and are often simple components which come into contact with the product. The total of these time based failures only account for 9% of all failures.
The other patterns highlight the fact the during the initial start-up of the equipment is when the majority of failure will occur. This could be due to maintenance induced failures, or manufacturing defects in the components. Once the initial start-up period has passed the failure are random. These patterns account for 86% of failure.
Now, these patterns state that the failures are random in nature, but that does not mean that they failures cannot be predicted or mitigated. It means that overhauls, and replacements conducted at a specific frequency are only effective in 9% of the cases.
In the rest of the failures, the equipment can be monitored and the right time to conduct a replacement, or overhaul is identified based on the condition of the equipment. This is known as Condition Based Maintenance, or Predictive Maintenance or even Don’t Fix It Unless It’s Broke!
In Closing
To learn more about these failure patterns, the book RCM2 by John Moubrary is the best resource around. I highly encourage that you read this book if you are serious about improving your understanding of failures in equipment.
As you look at these failure patterns, think about what percentage of PMs in your maintenance program are fixed time replacements, overhauls or intensive inspections that require the equipment to be disassembled? How does your program align with the findings about?
RCM or Reliability Centered Maintenance is an effective approach for determining the appropriate strategy based on this understanding of equipment failures. Next week, we will cover the use of a RCM methodology designed for industry which will deliver significant improvements in plant performance, Fast Track RCM.
Remember, to find success, you must first solve the problem, then achieve the implementation of the solution, and finally sustain winning results.
I’m James Kovacevic
Eruditio, LLC
Where Education Meets Application
Follow @EruditioLLC

[…] have found that there are six failure patterns that most equipment will go […]
James…you might want to check out the label under the bottom curve…I believe it should read “Random = 89%”.
Hey James, Nice post and patterns! Bathtub curve, Wear out, and Fatigue are major failure patterns that need special attention along with handling other equipment maintenance issues. Another equipment failure reason is applying improper or poor quality lubrication program. We can use quality oil filtration and storage systems to keep oil free of contamination and increase their shelf life. Overall a very handy guide on equipment failure and their main causes. Thanks for sharing with us!
whR US ecc PEOBLEM MEANS
Hello James
I have given a task in order to stablish a procedure or way of thinking regarding sudden increse of the failure rate in an population.
This is the case:
A Wind Turbine model with an operational fleet of 2000 turbines and the av. age of the fleet being 9 years, has had an sudden increase in system alarms and repair work orders.
Please talk us through the process of how you would approach this to rectify the issue and introduce improvements in the operational fleet.
What aspects would you investigate, stake holders you would involve, information to collect and how you would introduce and roll out your findings?”
Best Regards
Hi, Alfredo,
It is interesting the problem you described for the wind turbine. Have you found the cause of the problem? Have you done the data analysis on geographical comparison? the weather, the wind speed, the transportation, and the installation, plants that fabricated them, the contractors that installed them, the trucks that transported them. etc. Or may be the original studies/assessments missed some factors in the reliability calculations. I would like to know what the current status of these wind turbines. Thanks.
A vest study on failure curves which we are addressing today
How are you addressing them? What activities are you utilizing?