Using RBDs to model different systems and circumstances
In the previous post, the basics of a Reliability Block Diagram were covered using simple Series or Parallel paths. In real life, most systems or processes are not that simple and require a different level or type of models, often used in combination with other types.
So in our continued exploration of RBDs, let’s explore a few different models that may be used.
K OUT OF N MODELS
K out of N Models is used to indicate that a specific number of sub blocks must be functioning in parallel to ensure the block will operate. A further dive into the K out of N model shows that there are two types of K out of N models;
- The block contains N identical sub blocks (think identical 200GPM pumps). If less than K out of these N fails, the block is functional. Otherwise, it is failed. 1 < = K < = N. The number K (designate K(1)) is the minimal number of failed sub blocks defining the block failure.
- The block contains N different sub blocks (think a 400GPM, two 200GPM, and a 600GPM pump). The block contains N different sub blocks. N is the sum of all sub blocks outputs. As for K/N model, there are two definitions, “K out of N Failed” and “K out of N Operable.”
For both types of K out of N Models the following definition holds true: K out of N: O: If not less than K sub blocks are functional, the block is functional; otherwise it is failed. In this definition K (designate K(2)) is the minimal number of functional sub blocks providing the block functioning. Definitions (1) and (2) are equivalent, if K(1) = N – K(2) + 1 (or K(2) = N – K(1) + 1).
This type of model is used when there are multiple assets providing the same function and working together to deliver a defined output such as flow. In both examples above, the required output may be 600GPM. In the example of identical sub blocks, the model would be 3 out of 4 (3x 200GPM). In the example of different sub blocks, the model would change based on the pumps that are being considered 1x 600GPM, or 1x 200GPM & 1x 400GPM). Therefore it is important to know the system and how the model works.
Stand-By Models
Another reality that is commonly seen in real life is the use of standby equipment. Standby equipment usually takes a period of time to start-up and take over the function of the previously failed equipment. Due to the lag time to assume the function, and the fact that standby equipment is not always properly maintained, the modeling of standby equipment can become complicated
A standby block will typically have sub-blocks, but only one of the sub-blocks operates during the block operation. First, the primary sub-block operates, and then each of secondary sub blocks operates upon the primary or another secondary failure. Each next operating sub-block is switched on immediately after the failure of the previous one. The whole standby block fails if all its sub blocks fail. In the Standby model, sub blocks switch each other when fails and, sometimes, when they are repaired, so they are dependent.
For the STANDBY model, various “switching on” queues following “hot repair” of sub blocks are considered:
- CYCLIC – each repaired sub block (basic and standby) takes next number in the queue to operation. The program applies this switching type if both sub blocks have identical reliability parameters.
- BASIC BLOCK PREFERRED – repaired basic sub block is returned into operation immediately after repair and operating standby sub block is switched off. The program applies this switching type of basic and standby sub blocks have different reliability parameters.
Markov Models
 The RBD can be used with Markov Models and is described regarding states and transitions using State Transition Diagram (STD) of the corresponding Markov chain.
A block fails when it transits to a state enclosed to a failure mode. Transitions between states are caused by failures and repairs of sub blocks. Typically the reliability engineer will correspond each state to a good condition or failure mode. The state has a probability that will change with time. The STD calculation algorithm computes these probabilities for each time instant using Markov differential equations. Sum of all states probabilities at each moment = 1. Sum of good states probabilities = the block Reliability, if there are no repair transitions (from failed to good states); the same sum = the block Availability if there are repair transitions.
Transitions occur instantly, in the states the block stays during a time. Each block transition is the consequence of a sub block (driver) transition. So for each transition of STD user should select a driver block, if some of the change their modes during this transition. For the rest of the sub blocks (except driver) participating in this transition, the mode change is only the effect of driver transition. It is named ‘switched by the driver transition.’
An example of a Markov Model in use is when two power supplies are used in parallel. Both operate together at 50% load, however, once one fails, the other operates at 100%, with a 50% reduction in operating life. Therefore the repair time is a critical consideration in a Markov Model.
Network Models
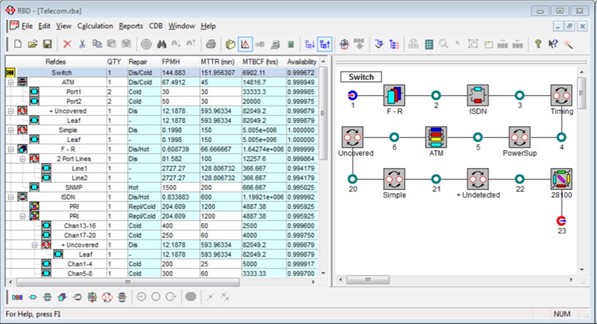
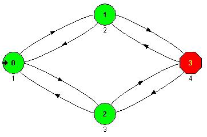
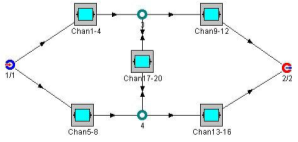
A network model could be used to model a communication system or pipeline (provided there are multiple paths in the pipeline). A typical network RBD contains connections (sub blocks) and nodes (contact points of sub blocks). Network blocks are considered in a failed state when there are no paths from its input nodes to its output nodes through all connections.
All sub blocks can have some input and output nodes. Inside the sub block, all input and output nodes are connected. When sub block fails, all internal connections are broken.
When working with network models, the flow of the product (information, electricity, oil, gas, etc.) needs to be considered. Each sub-block will need to define if it is unidirectional or bidirectional as it will have an impact on the model.
Other Considerations
In addition to these different types of models, there are a few additional items that should be considered when developing and modeling a system using RBD. First is the repair type;
- Replacement – The whole failed block is removed and replaced with an operational one. After the replacement, the new block is available for operation, and the replaced failed block may be discarded or repaired. For replacement blocks, the MTTR must be set in the field MTTR. This value is used for Availability and Down time calculations.
- Disassembly – The failed sub-blocks of the block are removed and replaced (and may also be disassembled). In this case, the block MTTR is calculated using sub-blocks MTTR values according to their repair type – hot or cold (see below). Availability and Down time is also calculated.
- No Repair – The failed block has no repair. Availability and Down time is not calculated.
Most repairs could also be classified as;
- Hot – Each faulty sub-block of the block can be repaired while the other (redundant) sub blocks operate.
- Cold – Faulty sub-blocks will be repaired or replaced only when the “parent” block is switched off after its failure. All fail sub blocks are repaired parallel.
Also, each block has many different parameters over and above Reliability;
- Reliability for a specified time value (Reliability definition time),
- Availability at steady state for repairable blocks,
- MTBCF (mean time between critical failures) at steady state for repairable blocks, MTTCF (mean time to critical failure) for non-repairable blocks,
- FPMH (mean number of failures per million hours),
- MTTR (mean time to repair or replacement),
- Down time (total repair time during specified reliability definition time),
- Reliability versus time array,
- Mode transition rates versus time array for Markov blocks.
Not all of the parameters need to be entered; some can be calculated from others. This is why it is important to fully understand the model and what is being calculated.
Oh the Complexity
Many of these models can become large and complex requiring extensive mathematical models and calculations. Once the various models are used in singularity or in combination, the RBDs are extremely complex. This is where a specialized software (such as BQR’s CARE RBD) can come in handy. But before using the software, be sure you understand the various models and how they work. Remember, Garbage In = Garbage Out.
If you aren’t using Reliability Block Diagrams in your Reliability, Availability, Maintainability, and Safety (RAMS) analysis, you should be as they are extremely powerful.
Remember, to find success; you must first solve the problem, then achieve the implementation of the solution, and finally sustain winning results.
I’m James Kovacevic
Eruditio, LLC
Where Education Meets Application
Follow @EruditioLLC
References;
