Using a Crow-AMSAA [Reliability Growth Analysis (RGA)] to Quantify Your Reliability Improvements (or Losses)
 Imagine being able to predict the next time a failure will occur for a piece of equipment without a huge amount of work. Wouldn’t it be nice to know the approximate point in time that a failure will occur on a critical piece of equipment? It is possible, but I am not talking about using MTBF, as it is not a good measure (if you need to understand why, please visit http://www.NoMTBF.com). What I am talking about is a Crow-AMSAA analysis.
This analysis enables organizations to answer many questions with relative ease. A Crow-AMSAA has many applications in a maintenance & reliability program and allows for gathering answers not available from a Weibull.
As Fred discussed in the previous post, a Weibull can be an extremely powerful tool in your reliability toolbox. As with all tools, a Weibull has applications that it can excel in, and those it can’t. A Crow-AMSAA excels in the fact that it can be used with mixed failure modes, something a Weibull is not good at.
What is a Crow-AMSAA?
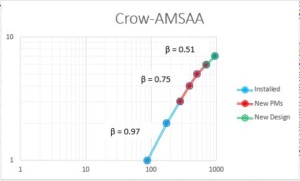
A Crow-AMSAA analysis is a way to see how reliability is trending for a piece of equipment or even for an entire facility. It is a plot of cumulative failures against cumulative time on logarithmetic graph.
With the cumulative failures plotted against the cumulative time, a slope is generated. This slope or Beta (β) indicates the trend in reliability. It is important to note that the Beta values do not mean the same thing as in Weibull;
- Beta < 1 indicates Reliability is Improving
- Beta = 1 indicates Reliability is Static
- Beta > 1 indicates Reliability is Deteriorating
When you extend the slope you are able to see when the next failure is likely to occur based on the history of the equipment. This is how you are able to forecast with the Crow-AMSAA. It is actually quite simple.
The failure data used for the Crow-AMSAA analysis does not have to be based upon a single failure mode, but it can be. If you use a single failure mode, then you will model the reliability of the specific component, with a specific problem and a specific cause.
If you choose just to look at the equipment or system as a whole, all that is needed is the date of a failure and the cumulative time in days between the failures and you can model the reliability. Everyone has this data in their CMMS.
It is important to note that multiple slopes can be plotted in a Crow-AMSAA analysis. This is powerful when you can identify specific dates that an improvement was made (equipment redesign, procedure change, material change, etc.). This allows you to show the impact that each of the improvements had on the operation.
When to Use a Crow-AMSAA?
A Crow-AMSAA analysis is extremely versatile and can be used for a variety of different applications;
- Planned Vs Actual: Track and trend planned vs actual reliability for a specific piece of equipment or a process. Also, predict when you will achieve your reliability goals.
- Track Reliability: Trend reliability visually with the graph, or through a trend indicator. The trend indicator could be the current Beta.
- Quantify the Cost of Unreliability: With the current reliability plotted, plot the expected (or anticipated) reliability that the equipment needs to achieve. You can see how much unreliability is costing you.
- Reliability Predictions: Use the power of the Crow-AMSAA as an early warning indicator. When you extend the slope you can anticipate the date of the next failure and work to prevent it.
- Correlation Between Improvements & Reliability:By including the different initiatives on a single plot, you can see which have the largest impact on reliability, allow you to transfer those to other pieces of equipment.
- Management Tool:The Crow-AMSAA can be used in other areas of the business as well. Think of safety. A “failure” could be a recordable incident. You can now apply this analysis to see if the safety program is actually making a difference.
I can imagine the wheels are turning now, and you are excited to try this powerful, but simple analysis. Thankfully you don’t need to have specialized software to accomplish this. You can conduct it in Excel*.
Preparing a Crow-AMSAA in Excel
Creating a Crow-AMSAA can be accomplished with specialized software, and there are some advantages to it, but there are costs associated with it. Instead, leverage the power within Excel to conduct a Crow-AMSAA analysis with these steps;
- Prepare Your Data: Prepare the failure data in a 5 column table. In column A put the failure date. Be sure to start with the birth date (when the equipment is installed, when it was overhauled, etc.). In column B you want to identify the time between each failure. Column C will be used as the X-axis of the chart, and here is where the cumulative time between failures is recorded. Column D will be used for the Y-axis of the chart, which will contain the cumulative failures. Essentially you are just putting the failure number. Lastly, in column E you can record comments for major events or changes in the equipment.
- Create a X Y Scatterplot Graph: Create a X Y scatterplot graph, using cumulative time (column C) for the X-axis and the cumulative failures for the Y-Axis. Add a title to the graph to indicate what the analysis is for.
- Convert the Axes to a Log Log: A key component of the Crow-AMSAA analysis is the fact that is based on a Logarithmetic scale. In order to change the X Y scatterplot to a Log Log scale, you need to select each axis to access its options and check logarithmic scale with a base of 10. This must be completed for the X & Y axes.
- Add Gridlines & Trend lines: In order to accurately predict the time of the next failure or the time to reach your goal you will need to turn the gridlines on. Click on each of the axis and add major and minor gridlines. Next click on the data points and add a linear trend line.
- Determine Slope: This is probably the most difficult part. Since the graph is in a Log Log format, you can’t just simply measure it. Start by adding 2 columns to the table; i) Cumulative time Log; and ii) Cumulative failures Log. Using the “log10” function, convert each other cumulative failures and cumulative times to a base of Log 10. With the data in the Log 10 format, you can now use the slope function to calculate the Beta for each data set.
Please note; if you want to utilize multiple improvements or changes on a single analysis, you will have to add a new data set for each one. Be sure to include the first and last data point for each data set. This will ensure the data is continuous in the analysis and is why we use the comment section in the original table. 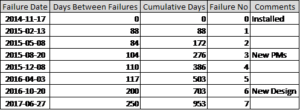
You now have a completed Crow-AMSAA analysis, and can now measure & trend your reliability. You can add some additional information to the graph such as the slope values (via a text box) or extend the lines to determine when your next failure will occur.
Use the Crow-AMSAA
Now that you have the data and the know how, what’s stopping you from measuring the reliability of your equipment / systems? Are you going to use the Crow-AMSAA to review impacts of your reliability improvements? By quantifying the losses and improvements you will be able to generate further support for your programs.
I remember reading that if Maintenance & Reliability professionals are doing their job, no one will notice. So use the Crow-AMSAA to share your success and quantify the improvements with dollars to ensure ongoing support for the activities.
In the next post, Fred Schenkelberg will discuss the analysis method of Mean Cumulative Plotting and how it is used to deliver benefits to your organization.
Remember, to find success, you must first solve the problem, then achieve the implementation of the solution, and finally sustain winning results.
I’m James Kovacevic
Eruditio, LLC
Where Education Meets Application
Follow @EruditioLLC
_
Fred Schenkelberg is an experienced reliability engineering and management consultant with his firm FMS Reliability. His passion is working with teams to create cost-effective reliability programs that solve problems, create durable and reliable products, increase customer satisfaction, and reduce warranty costs. If you enjoyed this article, consider subscribing to the ongoing series at Accendo Reliability.
—
The other articles in the series include:
Post 1 – Using the Maintenance Data You Already Have
Post 2 – The What & More Importantly, The Why of the Weibull Analysis
Post 3 – Quantify the Improvements with a Crow-AMSAA (or RGA)
Post 4 – Using a Mean Cumulative Plot
Post 5 – The Next Step in Data
Post 6 – The Next Step in Your Data Analysis
Post 7 – Data Q&A with Fred & James
—
References:
Fred Schenkelberg
FMS Reliability
Accendo Reliability
New Weibull Handbook
Imagine being able to predict the next time a failure will occur for a piece of equipment without a huge amount of work. Wouldn’t it be nice to know the approximate point in time that a failure will occur on a critical piece of equipment? It is possible, but I am not talking about using MTBF, as it is not a good measure (if you need to understand why, please visit http://www.NoMTBF.com). What I am talking about is a Crow-AMSAA analysis.
This analysis enables organizations to answer many questions with relative ease. A Crow-AMSAA has many applications in a maintenance & reliability program and allows for gathering answers not available from a Weibull.
As Fred discussed in the previous post, a Weibull can be an extremely powerful tool in your reliability toolbox. As with all tools, a Weibull has applications that it can excel in, and those it can’t. A Crow-AMSAA excels in the fact that it can be used with mixed failure modes, something a Weibull is not good at.
What is a Crow-AMSAA?
A Crow-AMSAA analysis is a way to see how reliability is trending for a piece of equipment or even for an entire facility. It is a plot of cumulative failures against cumulative time on logarithmetic graph.
With the cumulative failures plotted against the cumulative time, a slope is generated. This slope or Beta (β) indicates the trend in reliability. It is important to note that the Beta values do not mean the same thing as in Weibull;
- Beta < 1 indicates Reliability is Improving
- Beta = 1 indicates Reliability is Static
- Beta > 1 indicates Reliability is Deteriorating
When you extend the slope you are able to see when the next failure is likely to occur based on the history of the equipment. This is how you are able to forecast with the Crow-AMSAA. It is actually quite simple.
The failure data used for the Crow-AMSAA analysis does not have to be based upon a single failure mode, but it can be. If you use a single failure mode, then you will model the reliability of the specific component, with a specific problem and a specific cause.
If you choose just to look at the equipment or system as a whole, all that is needed is the date of a failure and the cumulative time in days between the failures and you can model the reliability. Everyone has this data in their CMMS.
It is important to note that multiple slopes can be plotted in a Crow-AMSAA analysis. This is powerful when you can identify specific dates that an improvement was made (equipment redesign, procedure change, material change, etc.). This allows you to show the impact that each of the improvements had on the operation.
When to Use a Crow-AMSAA?
A Crow-AMSAA analysis is extremely versatile and can be used for a variety of different applications;
- Planned Vs Actual: Track and trend planned vs actual reliability for a specific piece of equipment or a process. Also, predict when you will achieve your reliability goals.
- Track Reliability: Trend reliability visually with the graph, or through a trend indicator. The trend indicator could be the current Beta.
- Quantify the Cost of Unreliability: With the current reliability plotted, plot the expected (or anticipated) reliability that the equipment needs to achieve. You can see how much unreliability is costing you.
- Reliability Predictions: Use the power of the Crow-AMSAA as an early warning indicator. When you extend the slope you can anticipate the date of the next failure and work to prevent it.
- Correlation Between Improvements & Reliability:By including the different initiatives on a single plot, you can see which have the largest impact on reliability, allow you to transfer those to other pieces of equipment.
- Management Tool:The Crow-AMSAA can be used in other areas of the business as well. Think of safety. A “failure” could be a recordable incident. You can now apply this analysis to see if the safety program is actually making a difference.
I can imagine the wheels are turning now, and you are excited to try this powerful, but simple analysis. Thankfully you don’t need to have specialized software to accomplish this. You can conduct it in Excel*.
Preparing a Crow-AMSAA in Excel
Creating a Crow-AMSAA can be accomplished with specialized software, and there are some advantages to it, but there are costs associated with it. Instead, leverage the power within Excel to conduct a Crow-AMSAA analysis with these steps;
- Prepare Your Data: Prepare the failure data in a 5 column table. In column A put the failure date. Be sure to start with the birth date (when the equipment is installed, when it was overhauled, etc.). In column B you want to identify the time between each failure. Column C will be used as the X-axis of the chart, and here is where the cumulative time between failures is recorded. Column D will be used for the Y-axis of the chart, which will contain the cumulative failures. Essentially you are just putting the failure number. Lastly, in column E you can record comments for major events or changes in the equipment.
- Create a X Y Scatterplot Graph: Create a X Y scatterplot graph, using cumulative time (column C) for the X-axis and the cumulative failures for the Y-Axis. Add a title to the graph to indicate what the analysis is for.
- Convert the Axes to a Log Log: A key component of the Crow-AMSAA analysis is the fact that is based on a Logarithmetic scale. In order to change the X Y scatterplot to a Log Log scale, you need to select each axis to access its options and check logarithmic scale with a base of 10. This must be completed for the X & Y axes.
- Add Gridlines & Trend lines: In order to accurately predict the time of the next failure or the time to reach your goal you will need to turn the gridlines on. Click on each of the axis and add major and minor gridlines. Next click on the data points and add a linear trend line.
- Determine Slope: This is probably the most difficult part. Since the graph is in a Log Log format, you can’t just simply measure it. Start by adding 2 columns to the table; i) Cumulative time Log; and ii) Cumulative failures Log. Using the “log10” function, convert each other cumulative failures and cumulative times to a base of Log 10. With the data in the Log 10 format, you can now use the slope function to calculate the Beta for each data set.
Please note; if you want to utilize multiple improvements or changes on a single analysis, you will have to add a new data set for each one. Be sure to include the first and last data point for each data set. This will ensure the data is continuous in the analysis and is why we use the comment section in the original table.
You now have a completed Crow-AMSAA analysis, and can now measure & trend your reliability. You can add some additional information to the graph such as the slope values (via a text box) or extend the lines to determine when your next failure will occur.
Use the Crow-AMSAA
Now that you have the data and the know how, what’s stopping you from measuring the reliability of your equipment / systems? Are you going to use the Crow-AMSAA to review impacts of your reliability improvements? By quantifying the losses and improvements you will be able to generate further support for your programs.
I remember reading that if Maintenance & Reliability professionals are doing their job, no one will notice. So use the Crow-AMSAA to share your success and quantify the improvements with dollars to ensure ongoing support for the activities.
In the next post, Fred Schenkelberg will discuss the analysis method of Mean Cumulative Plotting and how it is used to deliver benefits to your organization.
Remember, to find success, you must first solve the problem, then achieve the implementation of the solution, and finally sustain winning results.
I’m James Kovacevic
Eruditio, LLC
Where Education Meets Application
Follow @EruditioLLC
_
Fred Schenkelberg is an experienced reliability engineering and management consultant with his firm FMS Reliability. His passion is working with teams to create cost-effective reliability programs that solve problems, create durable and reliable products, increase customer satisfaction, and reduce warranty costs. If you enjoyed this article, consider subscribing to the ongoing series at Accendo Reliability.
—
The other articles in the series include:
Post 1 – Using the Maintenance Data You Already Have
Post 2 – The What & More Importantly, The Why of the Weibull Analysis
Post 3 – Quantify the Improvements with a Crow-AMSAA (or RGA)
Post 4 – Using a Mean Cumulative Plot
Post 5 – The Next Step in Data
Post 6 – The Next Step in Your Data Analysis
Post 7 – Data Q&A with Fred & James
—
References:
Fred Schenkelberg
FMS Reliability
Accendo Reliability
New Weibull Handbook
